
当前最佳位置
#34
跨越1个商店
峰值
#34跟踪天数
2评分
39 图表历史
2 天由我们记录
商店
今天在1中绘制图表
评分
39 在App Store上
价格
在我们的窗口中更改了1次
安装和收入
苹果没有发布 — 我们不猜测
当前上榜
历史
基于 Astrina 自己的每日快照构建 — 每天一个数据点。
图表位置 — 🇺🇸 付费榜单
16.09 25.09
显示数字
| 天 | 位置 |
|---|---|
| 16.09 | #45 |
| 25.09 | #34 |
评分数量
16.09 25.09
显示数字
| 天 | 评分 |
|---|---|
| 16.09 | 39 |
| 25.09 | 39 |
截图



关于此应用
Stock screener pro allows you to combine multiple technical indicators and scan.
This is the PRO version of our free stock screener app. It has all the features that the free version has. The differences in this PRO version is
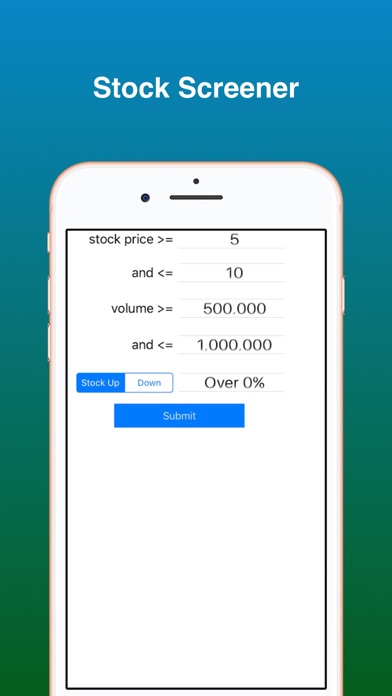
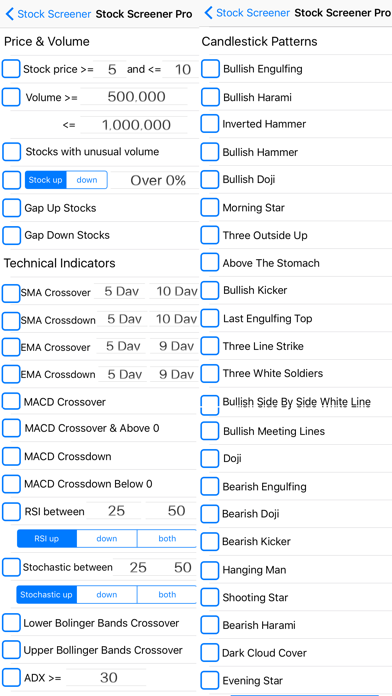
1. The Stock Screener Pro allows you to combine multiple technical indicators and scan the stock market. This will save you a lot of time as you no longer need to scan technical indicator one by one. For example, you can search for stocks trading in the range of $5-$10 with volume 100,000-1,000,000 that formed a bullish engulfing pattern and a macd crossover with one shot. It takes only a few seconds to get you the result sets you desired.
2. Removed Ads
Stock Screener search US stock market based on technical indicators which allows you to find trade setups to swing trade. This is an End of Day Technical Stock Screener, meaning the stock quote data is updated at the end of the day. We do not offer real time stock quotes for our stock screener. If you are a day trader, this app might not be useful. However, if you are a short term swing trader, you will find this stock screener app useful.
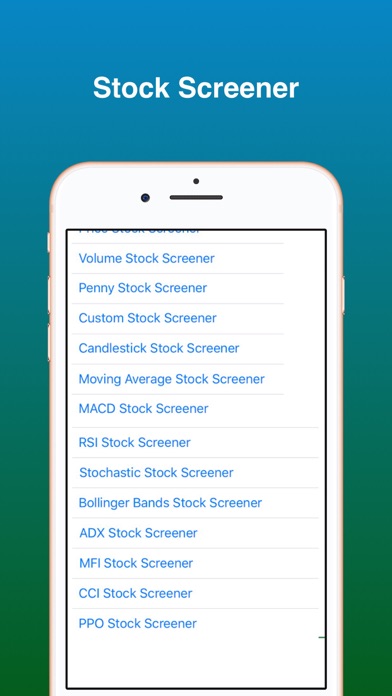
There are a variety of technical indicators that you can scan the stock market for trading setups.
You will find stocks to watch with our stock market screener.
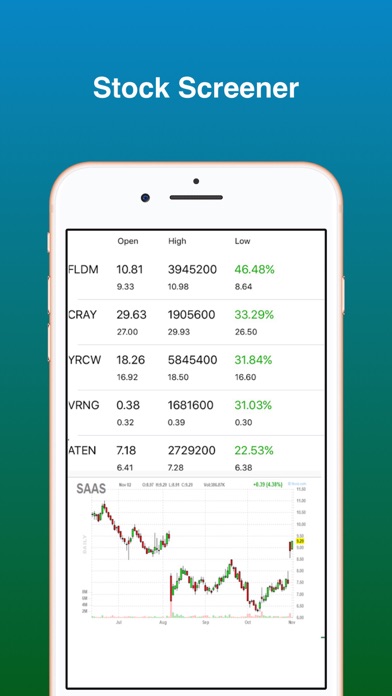
Our stock screener uses stock charts from Finviz. The stock charts uses intraday data which is delay by 15 minutes.
This stock scanner scans for stocks based on technical indicators only, it does not care about the fundamental data like PE ratio. If you are looking for a fundamental stock screener, this app is not for you.
Below is a list of the most popular stock chart patterns and technical indicators that you can use with our stock screener app.
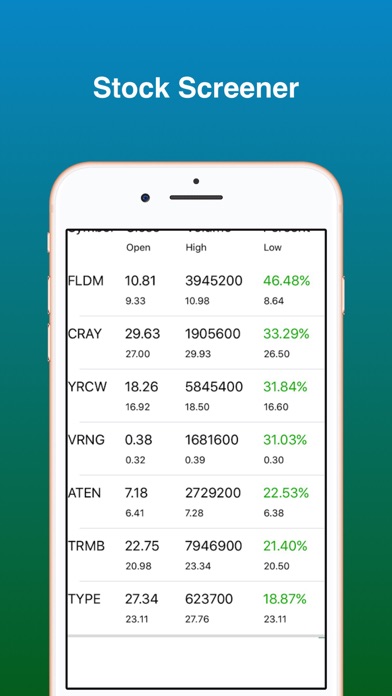
Daily Stock Gainers and Losers - You can find daily stock gainers and losers
Price Stock Screener - allows you to search for stocks based on price.
Volume Stock Screener - allows you to search for stocks based on volume moment.
Penny Stock Screener - allows you to search for small cap stocks as well as penny stocks listed on NYSE, NASDAQ and AMEX.
MACD Stock Screener - MACD is a popular technical indicator that are widely used by swing traders. Our MACD stock screener allows you to scan for MACD crossover, cross down patterns.
Candlestick Stock Screener - Our candlestick stock screener allows you to scan for the most popular candlestick patterns. Many of these patterns are reversal patterns allowing you to jump on a trend early.
RSI Stock Screener - allows you to find oversold and overbought stocks and stocks with RSI increasing or decreasing.
Moving Average Stock Screener - Moving average crossovers generate bullish signal. You can add stocks to your watchlist when these crossover occurs. You can use both moving average and exponential moving average.
Bollinger Band Stock Screener - Bollinger Band is a nice chart pattern to see when you should get in or get out from a stock. The idea is when the stock price moves above the upper bollinger band, it is time to sell. When the stock price moves above the lower bollinger band, it is time to buy.
Stochastic Stock Screener - Stochastic can be use as a leading indicator when you use it to find overbought and oversold stocks.
ADX Stock Screener - ADX is a technical indicator to measure the strength of a stock trend without regard to its direction. Our ADX screener gives you the ability to scan for stocks with strong trends.
MFI Stock Screener - is a technical indicator that uses stock price and volume to measure buying and selling pressure. It can also be used to find oversold and overbought stocks.
CCI Screener - Commodity Channel Index can be used to identify a new trend or warning of extreme conditions when a stock is overbought or oversold. CCI Stock Screener
This is the PRO version of our free stock screener app. It has all the features that the free version has. The differences in this PRO version is
1. The Stock Screener Pro allows you to combine multiple technical indicators and scan the stock market. This will save you a lot of time as you no longer need to scan technical indicator one by one. For example, you can search for stocks trading in the range of $5-$10 with volume 100,000-1,000,000 that formed a bullish engulfing pattern and a macd crossover with one shot. It takes only a few seconds to get you the result sets you desired.
2. Removed Ads
Stock Screener search US stock market based on technical indicators which allows you to find trade setups to swing trade. This is an End of Day Technical Stock Screener, meaning the stock quote data is updated at the end of the day. We do not offer real time stock quotes for our stock screener. If you are a day trader, this app might not be useful. However, if you are a short term swing trader, you will find this stock screener app useful.
There are a variety of technical indicators that you can scan the stock market for trading setups.
You will find stocks to watch with our stock market screener.
Our stock screener uses stock charts from Finviz. The stock charts uses intraday data which is delay by 15 minutes.
This stock scanner scans for stocks based on technical indicators only, it does not care about the fundamental data like PE ratio. If you are looking for a fundamental stock screener, this app is not for you.
Below is a list of the most popular stock chart patterns and technical indicators that you can use with our stock screener app.
Daily Stock Gainers and Losers - You can find daily stock gainers and losers
Price Stock Screener - allows you to search for stocks based on price.
Volume Stock Screener - allows you to search for stocks based on volume moment.
Penny Stock Screener - allows you to search for small cap stocks as well as penny stocks listed on NYSE, NASDAQ and AMEX.
MACD Stock Screener - MACD is a popular technical indicator that are widely used by swing traders. Our MACD stock screener allows you to scan for MACD crossover, cross down patterns.
Candlestick Stock Screener - Our candlestick stock screener allows you to scan for the most popular candlestick patterns. Many of these patterns are reversal patterns allowing you to jump on a trend early.
RSI Stock Screener - allows you to find oversold and overbought stocks and stocks with RSI increasing or decreasing.
Moving Average Stock Screener - Moving average crossovers generate bullish signal. You can add stocks to your watchlist when these crossover occurs. You can use both moving average and exponential moving average.
Bollinger Band Stock Screener - Bollinger Band is a nice chart pattern to see when you should get in or get out from a stock. The idea is when the stock price moves above the upper bollinger band, it is time to sell. When the stock price moves above the lower bollinger band, it is time to buy.
Stochastic Stock Screener - Stochastic can be use as a leading indicator when you use it to find overbought and oversold stocks.
ADX Stock Screener - ADX is a technical indicator to measure the strength of a stock trend without regard to its direction. Our ADX screener gives you the ability to scan for stocks with strong trends.
MFI Stock Screener - is a technical indicator that uses stock price and volume to measure buying and selling pressure. It can also be used to find oversold and overbought stocks.
CCI Screener - Commodity Channel Index can be used to identify a new trend or warning of extreme conditions when a stock is overbought or oversold. CCI Stock Screener
详情
| 开发者 | Qiting Huang |
|---|---|
| 类别 | 金融 |
| 价格 | $29.99 |
| 年龄评级 | 4+ |
| 版本 | 1.10 |
| 大小 | 1.3 MB |
| 最低 iOS | 15.6 |
| 包 ID | com.stockscanner.stockmarket.StockScreenerPro |
| 发布 | 2015-12-02 |
| 最后更新 | 2026-08-29 |
| 语言 | 1 语言 |
此页面回答的问题
- Stock Screener Pro - Technical 应用评论
- Stock Screener Pro - Technical 应用评级
- Stock Screener Pro - Technical 下载
- Stock Screener Pro - Technical 应用商店排名
- Stock Screener Pro - Technical 评论
- Stock Screener Pro - Technical 评论和评分
- Stock Screener Pro - Technical 是否合法
- Stock Screener Pro - Technical 是否是骗局
- Stock Screener Pro - Technical 真实用户评论
- Stock Screener Pro - Technical 评分
- Stock Screener Pro - Technical 投诉
- 人们对 Stock Screener Pro - Technical 的看法
- Stock Screener Pro - Technical 应用 评论
- Stock Screener Pro - Technical 优缺点
- Stock Screener Pro - Technical 经验
- 我应该信任 Stock Screener Pro - Technical 吗
- Stock Screener Pro - Technical 反馈
- Stock Screener Pro - Technical 评论 2026
- Stock Screener Pro - Technical 检查
- Stock Screener Pro - Technical 安全检查
